Today marks the close of the first quarter since I started my weekly newsletter. For those reading this who don’t know what I’m talking about, let me explain: every week I send out an email that contains links to things I’ve written and found online. Usual topics include tech news and commentary, coverage of the venture capital industry and the occasional set of links to articles, podcasts and other stuff I found interesting that week.
If you don’t subscribe but would like to, you can do so on this page over here.
Maintaining this newsletter pushes me to seek out more interesting information and to improve my skills as a short-form writer and “curator”. And it has allowed me, in some tangential way, to maintain a connection to friends and mentors I don’t get the opportunity to see or speak with that often. I’ve received a lot of positive feedback from friends and strangers, and I plan to continue publishing this weekly newsletter for some time to come.
In the interest of transparency, and to keep myself accountable to readers, I wanted to share some details about how my newsletter has performed in the eleven weeks leading up to this one.
Background
I started publishing my newsletter in May of 2016 as an experiment. I was uncertain whether I’d publish more than a handful of them, and given that I had no prior experience writing or curating a newsletter, I was uncertain how I would compare to other newsletters or email campaigns.
Apart from sharing a subscription link on my personal Facebook and Twitter profiles at one point I didn’t do much to promote subscriber growth.
I currently rely on two distribution channels for my newsletter: Tinyletter and my personal website. Up until this point I’ve cross-posted the content I distribute on Tinyletter to to a separate feed on my website and occasionally share links to those newsletter posts via Twitter and Facebook. However, this report exclusively evaluates the performance of the newsletter on Tinyletter, as it is the primary distribution channel.
Measuring and Evaluating Quarterly Performance
Summary Statistics
- Between the first edition on May 1 through the eleventh, published last week, the subscriber base has grown by 265%, from 17 close friends and family to 62 people last week. (It’s now higher.) Now I don’t know the majority of people who subscribe to me, which is a good thing.
- Just in the main body of the first eleven newsletters, I have written 11,211 words, averaging in at 1019 words per week.
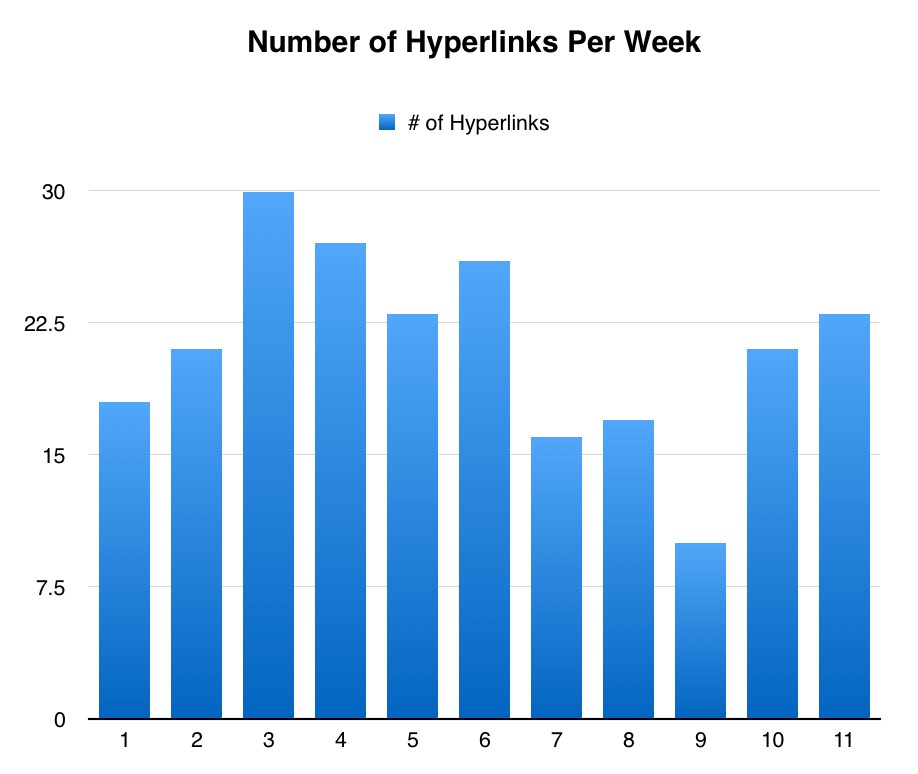
- I’ve included 232 links to things I’ve written or found on the internet, averaging 21 links per week.
Note: Tinyletter does not track subscriber attrition in a way that I can easily translate into a data table. Else, I’d have discussed churn in greater depth.
Subscriber Growth & Open Rate
As I mentioned in the summary statistics, my newsletter has a small but dedicated audience. I originally added seventeen close friends from college, an entrepreneurship organization I belonged to, a few mentors and, of course, my mom and dad.
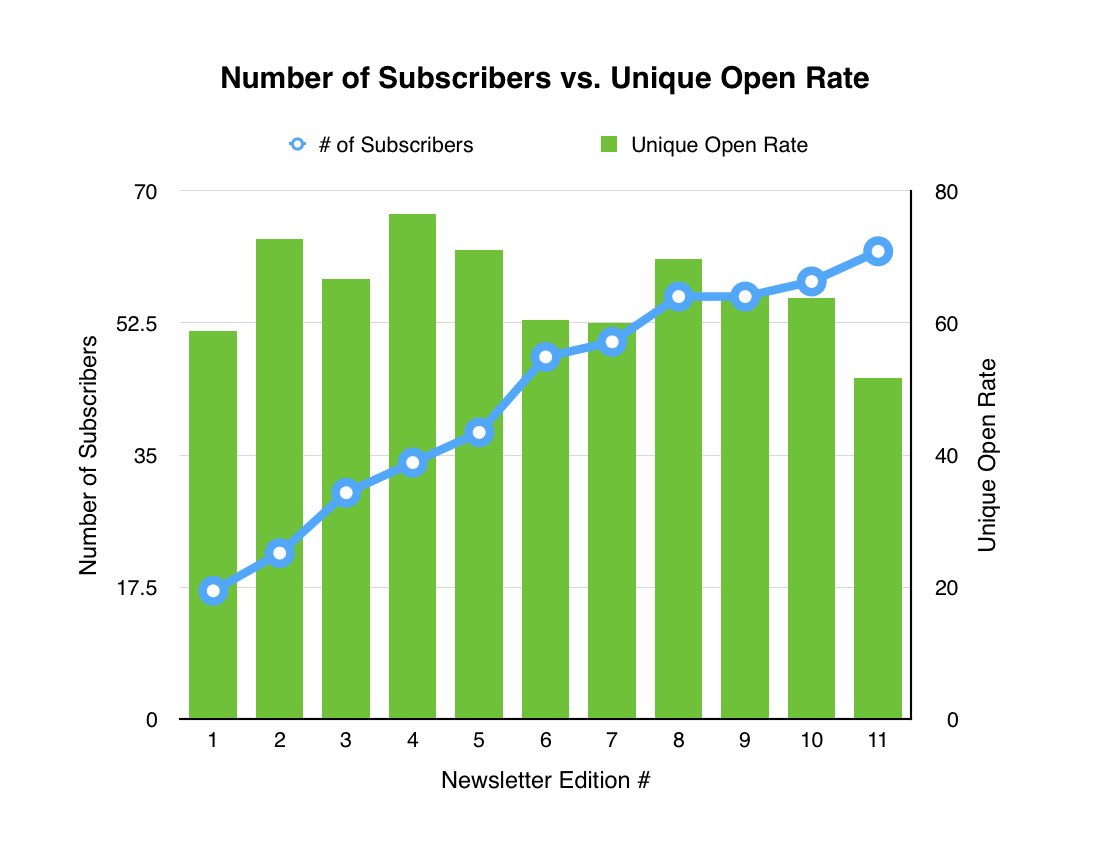
Despite significant growth over the last quarter, my newsletter maintains a relatively consistent unique open rate: averaging in at approximately 60% each week.
This is markedly (by a factor of two or three) higher than the benchmarks for email open rates compiled and published by Mailchimp, the parent company of Tinyletter. Granted, the Mailchimp report concerns marketing emails, but they’re the best comparative statistics I could find.
Word Counts Over Time
My average newsletter weighs in at roughly 1000 words, but individual issues of the newsletter have had as few as 578 words and as many as 1455.
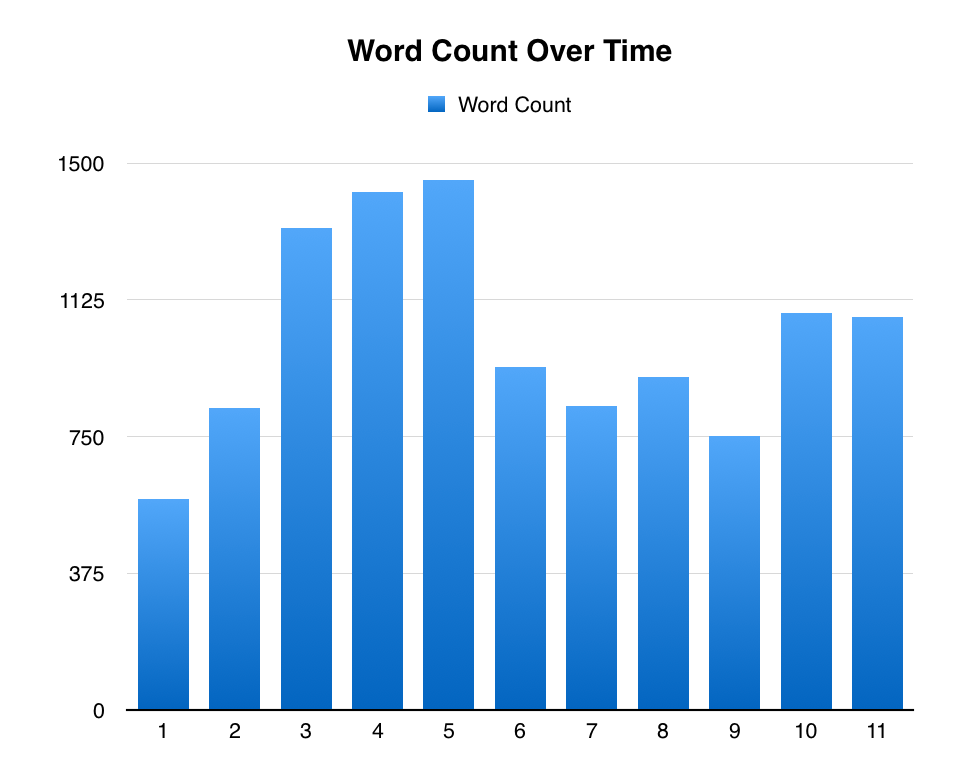
Although I feel more satisfied by the longer editions of my newsletter, there does not appear to be a meaningful correlation between length and subscriber growth or future open rates.
Hyperlink Counts and Hyperlink Density
A recurring theme in the feedback I’ve received about my newsletter is the high value derived from the links I provide to outside resources.
Basically since the third edition of my newsletter came out, I have paid a lot of attention to finding and including links to interesting things I’ve found online and linking to news resources as a form of citation in my commentary on tech/VC news and trends.
Here as well, there has been some significant variation.
Of course, this is taken out of context. The number of links included per newsletter is certainly influenced by the length of the newsletter. So, I created a little metric I’m going to call “Hyperlink Density”, which is found by dividing the number of words by the number of hyperlinks. I want to maximize the density of hyperlinks in my newsletters, which means I’m trying to keep the resulting number as low as possible.
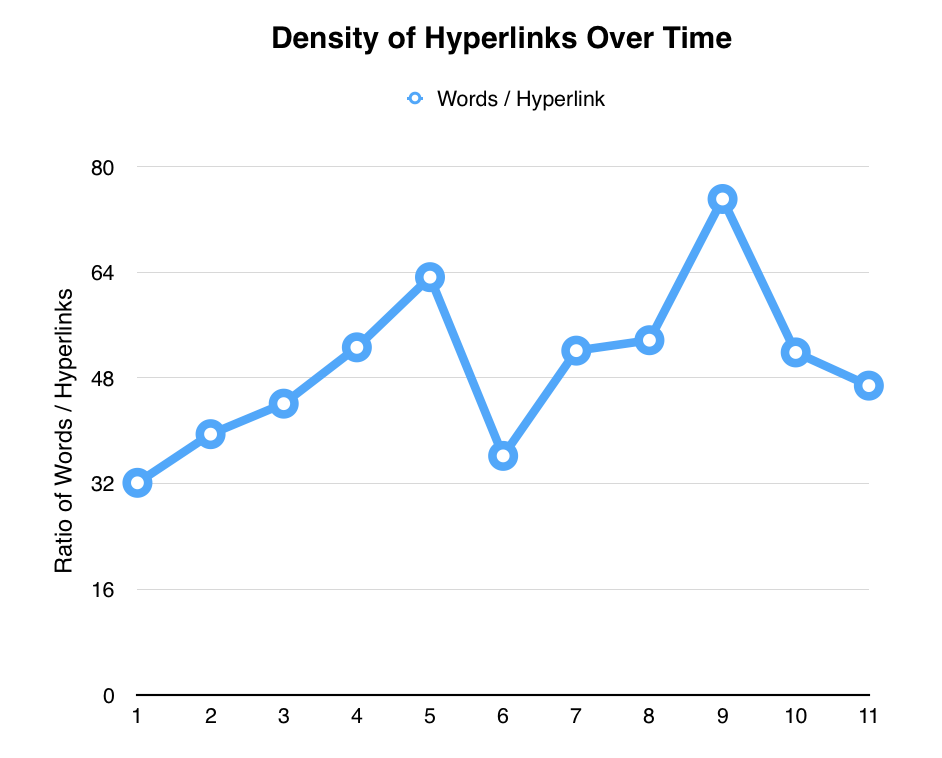
It’s easy to see that, over time, there is a slight downtrend in hyperlink density.
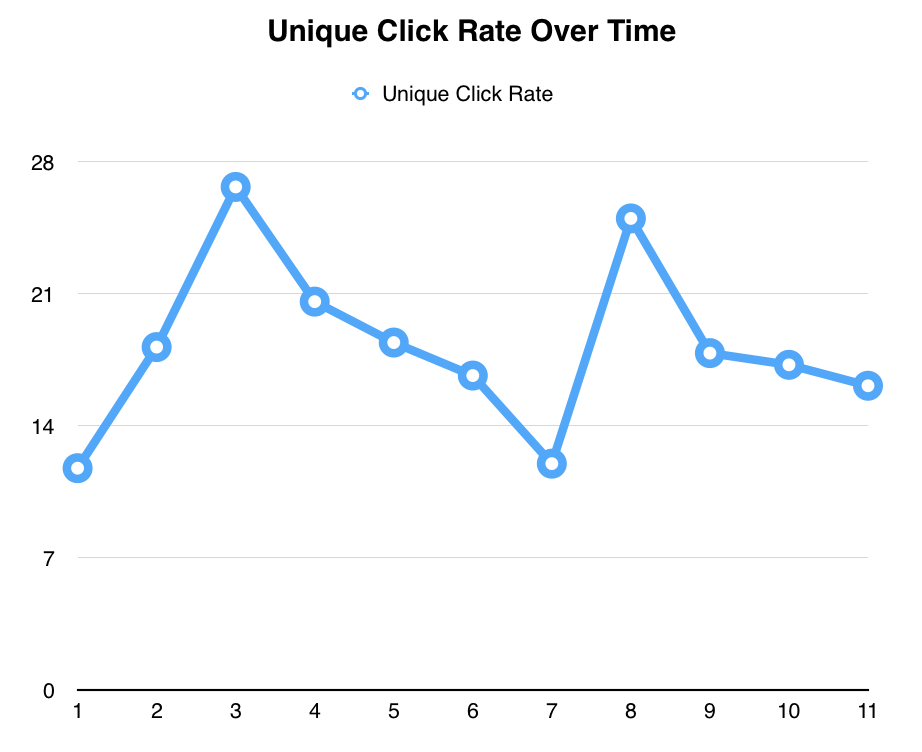
Click Rates & “The Clickiness Factor”
I found that the lowest performing issues of my newsletter far exceed the average unique click rates published in the Mailchimp report. Although this is likely a combination of the small size of my newsletter’s subscriber base and its composition and the fact that I use my newsletter as the primary distribution channel for certain kinds of content I publish, I nonetheless find this quite heartening.
The “Unique Click Rate” is the number of individuals who click on links in a given edition of the newsletter divided by the number of subscribers. It’s basically the percentage of people who got the email and clicked on something. The rough average of click rates from the Mailchimp report is around 2-2.5%.
But to me, the most interesting number is the total number of clicks and that data point’s relationship to the number of individuals who clicked a link. (So, “Total clicks” and “Unique clicks”, respectively.)
Dividing total clicks by unique clicks give me what I’m just going to call the clickiness factor. (There is probably a technical term for this that I don’t know.) It shows the mean number of links clicked by those users who were sufficiently engaged in the content to click on something.
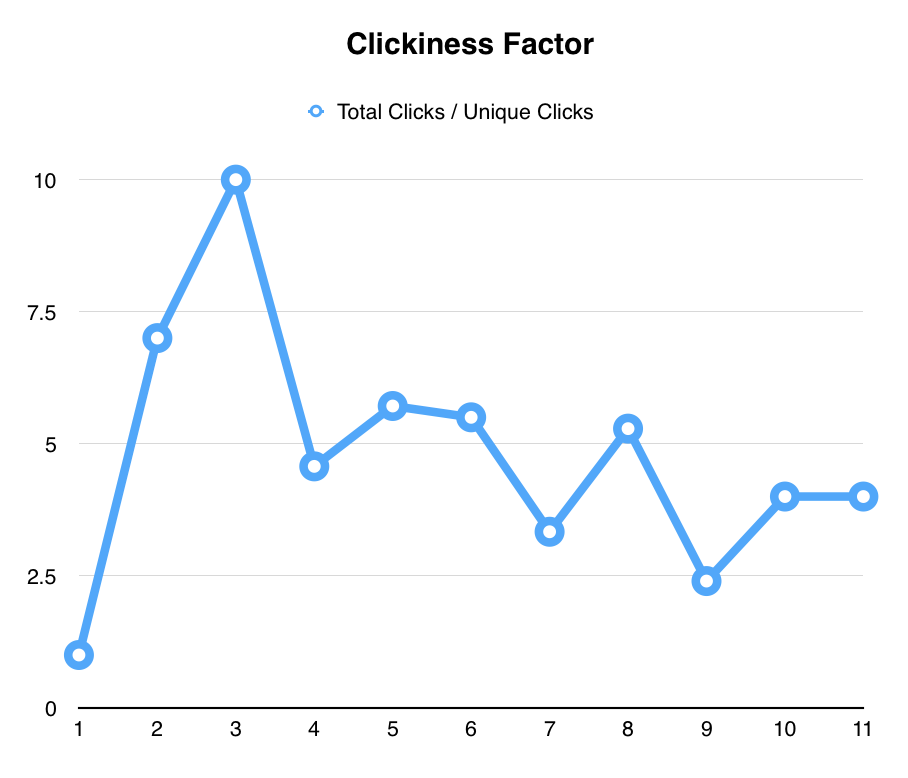
The metric has its shortcomings. For example, the fourth edition of my newsletter had 80 clicks for 8 unique people who clicked something, resulting in a clickiness factor of 10. It’s entirely possible that one of those eight people went totally bonkers and clicked a lot of stuff and skewed the numbers higher. With such a small sample size and no deeper metrics from my newsletter platform, there is no way to separate the average user from the incredibly engaged one. But nonetheless, it’s fairly good at signaling the kinds of content readers respond most to.
Unfortunately, there appears to be a slow downtrend in clickiness factor over time. It appears as though clickers were more engaged with my earlier work.
The good news is that there is always room to improve.
Objectives For Next Quarter
- Successfully execute a rebrand of the newsletter
- Double the number of subscribers to at least 125 while maintaining a quarterly average open rate of 55% or higher. (This quarter’s average was 65%.)
- Maintain weekly publishing schedule and A-B test publication days to see if Saturdays result in better performance vs. Sundays, or vice versa.
- Try to collaborate with readers of this newsletter on interesting and original content for my main blog.
- Solicit more feedback on the newsletter.
Leave a Reply